Nvidia in the AI Revolution
In the nearly four years since ChatGPT launched, Nvidia’s stock has gone from about $16.9 to about $217 (split-adjusted), roughly 13 times its starting price. On June 18, 2024 it passed Microsoft and Apple to briefly become the most valuable listed company in the world, the undisputed leader of this AI revolution. History has seen similar technological revolutions many times: Britain’s canal mania in the 1790s, Britain’s railway mania in the 1840s, and the internet and telecom equipment bubble of the late 1990s. All of them followed the same path: frenzied investment, then a bursting bubble, then long-term growth.
The cycle of technological revolutions
Three phases of a technological revolution
In Technological Revolutions and Financial Capital: The Dynamics of Bubbles and Golden Ages, Carlota Perez divides the cycle of a technological revolution into three phases[1]:
- Installation period: a new technology appears, capital floods in to speculate on it, and a bubble forms.
- Turning point: the bubble bursts, the economy goes into recession, and institutions and regulation adjust.
- Deployment period: the technology actually spreads through the whole economy, bringing long-term prosperity until it matures and the next revolution arrives.
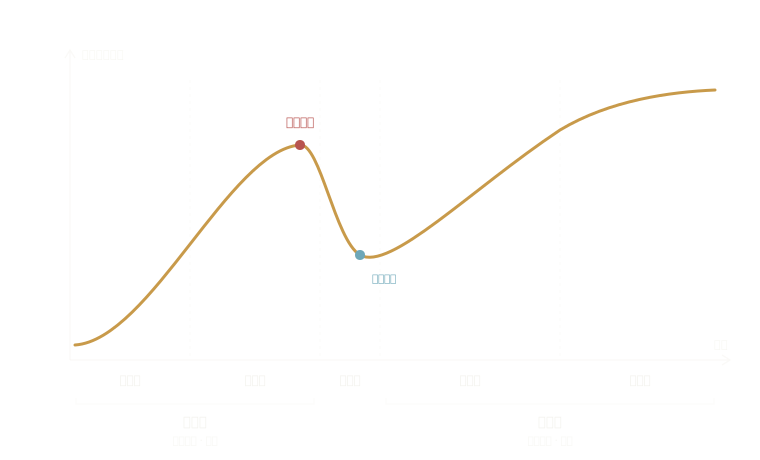
In the installation period, growth is driven by investment, and money pours into the companies building infrastructure: the shovel sellers. Then high expectations run into real-world friction, the bubble bursts, and the industry consolidates at the turning point. Finally, the survivors build businesses on top of cheap infrastructure, society gradually adapts to the new technology, and long-term, consumption-driven growth begins.
In terms of speed, the installation period moves fast, because expectations and investment can rush instantly into a single node, the shovel sellers. The bust at the turning point is even faster, since panic always outruns greed. The deployment period is the slowest, because consumption-driven businesses have to work through all kinds of real-world friction, but it also has the most room to grow.
Three historical cases
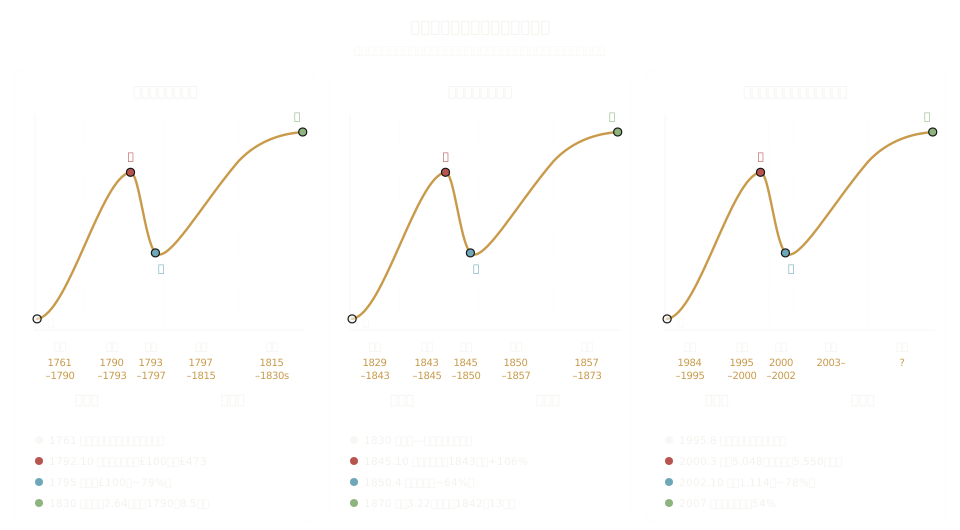
All three cases fit the same framework. The installation period is driven by investment, and shovel sellers and asset prices soar. The turning point is triggered by tightening money, and shovel sellers fall the hardest. The deployment period is driven by real usage, and new businesses grow for a long time on cheap infrastructure.
Canal mania (UK, 1761–1830s)
Canals were the new infrastructure of the early Industrial Revolution: a horse could pull about 1 ton of goods over land, but 30 to 50 tons on a canal. There were no independent equipment makers in this period; the canal companies were themselves the shovel sellers.
- Installation (1761–1793): In 1761 the Bridgewater Canal reached Manchester, local coal prices promptly halved, and it became the showcase project. For nearly 30 years afterward investment stayed cautious, until the frenzy of the early 1790s: the number of new canals authorized by Parliament each year went from 1 in 1790 to 21 in 1793, and the authorized capital of approved canals rose from £90,000 to about £2.82 million. In October 1792, Grand Junction Canal shares went from their £100 par value to £472.75 within a month[2].
- Turning point (1793–1797): In February 1793 France declared war on Britain, credit tightened, and a financial panic broke out; about a quarter of the roughly 400 country banks failed. By 1795 Grand Junction shares were back to about £100, down roughly 79% from the peak. In 1797 the Bank of England suspended the convertibility of notes into gold[3].
- Deployment (1797–1830s): Canals approved during the bubble were completed one after another, and by 1815 the network was largely finished at about 4,000 miles. Coal and raw cotton could now reach factories cheaply. British raw cotton imports rose from 31 million pounds in 1790 to 264 million pounds in 1830, and factory cotton spinning became the leading industry of industrialization.
Railway mania (UK, 1829–1873)
The historian Andrew Odlyzko argues that, by several measures, this was the largest technology mania in history[4]. The shovel sellers were the railway companies and the iron industry that supplied them with rails and locomotives.
- Installation (1829–1845): The Rainhill Trials in 1829 and the opening of the Liverpool and Manchester Railway in 1830 showed passenger demand far beyond expectations, and the railway companies paid generous dividends. The frenzy started after 1843: railway acts passed by Parliament each year went from 48 in 1844 to 120 in 1845, subscribing to a new line required only about a 10% deposit, and more than half of newspaper space was railway advertising. The railway share index peaked in October 1845, up 106% from early 1843.
- Turning point (1845–1850): After the Bank of England raised rates, the index fell 20% in just over a month, but construction kept its momentum: in 1846 Parliament approved 272 acts covering about 9,500 miles of line, and railway investment in 1847 reached £44 million, about 7% of GDP. That same year shareholders were called on to pay up the rest of their subscriptions, which, combined with a food crisis, set off a financial panic[5]. In 1849 the “Railway King” George Hudson was exposed for paying dividends out of capital, and in April 1850 the index bottomed, down 64% from its peak[4]. Lines approved during the bubble kept being completed, and the network grew from about 2,500 miles in 1845 to about 6,600 miles in 1850.
- Deployment (1850–1873): Passenger journeys rose from 24.7 million in 1842 to 322 million in 1870. Thomas Cook’s railway excursions created modern tourism, and many of the roughly 6 million visits to the Great Exhibition of 1851 came by train. Limited liability legislation in 1855–1856 established the modern system of corporate finance.
Telecom equipment and fiber bubble (US, 1984–2008)
The internet convinced the market that demand for bandwidth would grow without limit. Capital rushed into carriers and the equipment makers that supplied them; Cisco, Lucent, and Nortel were the shovel sellers this time.
- Installation (1984–2000): AT&T was broken up and Cisco was founded in 1984. Netscape’s IPO in August 1995 kicked off the internet investment boom, and the Telecommunications Act of 1996 opened up competition, so new carriers borrowed heavily to lay fiber. Cisco’s revenue grew from $2.2 billion in fiscal 1995 to $18.9 billion in fiscal 2000, roughly 8.6x[6]. The Nasdaq peaked at 5,048 on March 10, 2000; on March 27 Cisco’s market cap hit about $555 billion, briefly making it the world’s most valuable company, at a P/E of around 200.
- Turning point (2000–2002): After a series of Fed rate hikes, carrier capex fell off a cliff. Cisco’s revenue kept growing on momentum after the stock peaked, reaching $22.3 billion in fiscal 2001, but that year it also wrote down about $2.2 billion of inventory; Lucent lost about $16 billion for the year, and Nortel lost about $19.4 billion in a single quarter. In July 2002 WorldCom’s accounting fraud came to light and it filed for bankruptcy with $107 billion in assets. On October 9 the Nasdaq fell to 1,114 (−78% from the peak) and Cisco to $8.12 (−90%), while only about 2% to 5% of the fiber laid in the US was lit[7].
- Deployment (2002–): The glut of fiber sharply lowered the cost of bandwidth. Google’s revenue grew from $86.4 million in 2001 to $21.8 billion in 2008, with its IPO in August 2004 along the way. The share of American adults with home broadband went from 1% in 2000 to 54% in 2007[8], the year the iPhone launched. The shovel sellers recovered slowly, though: Cisco’s stock did not regain its 2000 high until December 2025[9].
Why the cycle keeps repeating
Growth in the installation period is driven by investment, and investment comes from expectations. Keynes called this driving force “animal spirits”: the future cannot be calculated precisely, so investment depends largely on confidence and imagination. A good story can spread through the market within months (what Shiller calls narrative economics), get amplified by easy money, and send valuations soaring. The real world, however, is full of constraints and friction: canals take a decade or more to dig, and users take time to form new habits. Competition also makes over-investment the rational choice for every company. Invest too little and you might be knocked out, so everyone builds at the scale needed to win the whole market. Individual rationality adds up to collective excess, which economists call the fallacy of composition. That is why bubbles never lack sober voices, like Greenspan’s “irrational exuberance” speech in 1996[10], and why those voices never manage to stop them from growing.
As the gap between expectations and reality widens, the turn comes as soon as money gets more expensive: war between Britain and France in 1793, the Bank of England’s rate hike in 1845, the Fed’s string of hikes around 2000. The sequence of “credit expansion, mania, panic” described by Minsky and Kindleberger plays out again and again. Shovel sellers fall the hardest, for two reasons. The first is the accelerator principle: orders for capital goods depend on the growth rate of demand, not on demand itself, so as soon as growth slows from breakneck to normal, orders collapse; Cisco’s huge inventory write-down in 2001 was the result of orders suddenly vanishing. The second is valuation: shovel sellers carry the highest expectations during the installation period, so at the turn their earnings and their valuations fall together. Cisco’s revenue in fiscal 2002 was roughly the same as in fiscal 2000, yet its stock fell 90%; most of what was lost was a P/E of around 200.
But the canals, railways, and fiber that the bubbles left behind were durable and general-purpose. Latecomers picked them up cheaply and built cotton mills, mass tourism, and internet services on top of them, starting what Perez calls the long-term growth led by production capital. Durable infrastructure is a gift to latecomers but a burden for shovel sellers: the excess capacity takes years to absorb, and in the meantime nobody needs to buy anything new, which is why Cisco’s stock took 25 years to return to its high. In the AI era, data centers and power grids can last for decades, but GPUs are usually replaced every three to five years. That difference determines how closely Nvidia will repeat Cisco’s script, and I come back to it in the section on supply.
Understanding Nvidia
In this framework, Nvidia sits in the shovel-seller position of the installation period, much like Cisco in 2000 or railway stocks in the 1840s. Two lines matter most for where it goes from here: on the demand side, the growth rate of big tech capex; on the competition side, Nvidia’s margins.
There is, however, one important difference between Nvidia and the Cisco of 2000: valuation. Cisco peaked at a P/E of around 200, while Nvidia’s forward P/E in mid-2026 was about 23[11]; its rise over the past few years has been driven mainly by profit growth rather than multiple expansion. This means that even if the bubble bursts, Nvidia is more likely to see a decline driven by falling profits than the combined collapse of profits and valuation that hit Cisco, so the bust may be relatively mild.
Below I go through revenue mix, demand, competition, supply, and geopolitics, each with the indicators worth keeping a close eye on.
Revenue mix: heavily dependent on big tech capex
In the first half of fiscal 2027 (February to July 2026), Nvidia had $177.8 billion in revenue, of which data center was $164.2 billion, about 92%, up roughly 105% year over year; everything else combined was under a tenth[12][13]. Under Nvidia’s new reporting breakdown, public clouds and large internet companies account for about half of data center revenue[14]. These are a handful of big tech companies such as Amazon, Microsoft, Google, and Meta, so Nvidia’s revenue depends to a large extent on their capex.
Take Amazon. Its 2026 capex guidance was raised from about $200 billion to $220 billion[15]. First-quarter capex alone was $43.2 billion, up nearly 80% from $24.3 billion a year earlier, and as of the second quarter its trailing-12-month free cash flow had fallen from $18.2 billion a year earlier to −$7.6 billion[16]. Big tech balance sheets are strong enough to keep borrowing and investing, so what is really unsustainable is not the investment itself but capex growing faster than operating cash flow for a long time. By the accelerator principle, once that growth rate peaks, Nvidia’s orders will decline before actual AI usage does. Also, Amazon’s main stated reason for raising capex was higher memory prices, so part of the capex growth is cost inflation rather than more compute.
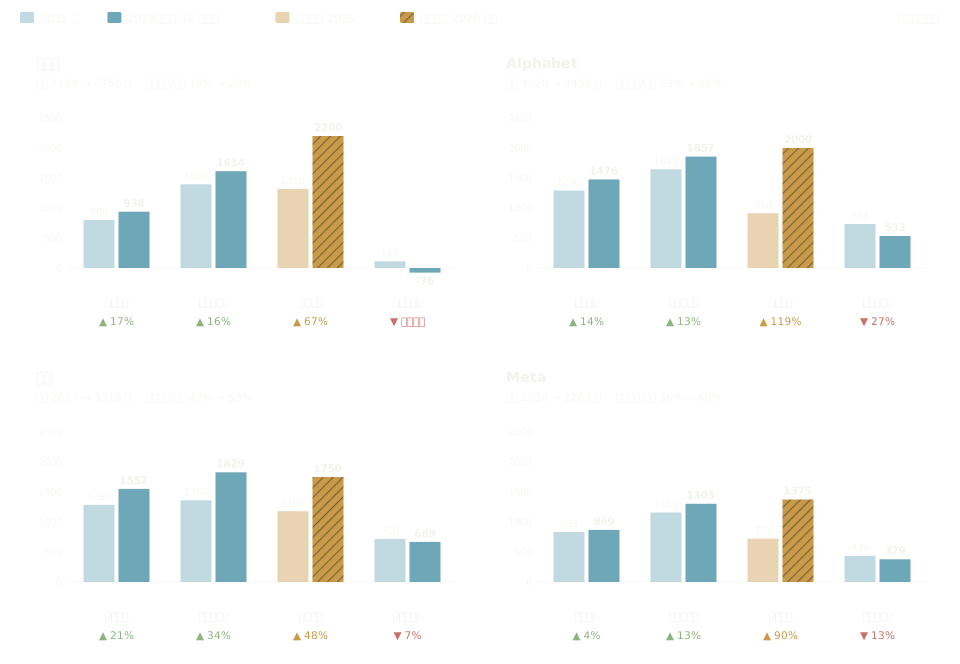
Indicators to watch: big tech capex guidance for the next quarter, focusing on the growth rate rather than the total; the ratio of operating cash flow to capex at the big tech companies; the share of Nvidia’s revenue from its top customers.
Circular financing: a familiar warning sign
Late in the installation period, shovel sellers often start lending customers money to buy their own products. Around 2000, Lucent and Nortel provided large amounts of vendor financing to new carriers; when those customers went bust, the loans and the orders vanished together. In September 2025, Nvidia announced it would invest up to $100 billion in OpenAI, which would then use that money to buy Nvidia chips[17]. Negotiations dragged on for months, and in February 2026 the deal was reportedly scaled down to about $30 billion[18]. A sizable part of the other half of data center revenue also comes from AI clouds such as CoreWeave and Nebius, which borrow heavily to build compute, count OpenAI and Microsoft among their largest customers, and in some cases have Nvidia as a shareholder. Arrangements like these make revenue look stronger than real demand, and they shift customer risk onto the shovel seller itself.
Indicators to watch: the size of Nvidia’s investment and financing commitments to customers; the share of debt in the capex of big tech, AI clouds, and AI companies.
Demand I: if challengers exit, training demand will shrink
The bar for training frontier models keeps rising. Once the leading models open up a clear capability gap, challengers who can’t keep up will stop spending to train frontier models and instead call the leaders’ models or focus on niche use cases. The leaders will keep investing, but the number of buyers will drop sharply. And once rivals exit, the pressure of the arms race eases; the leaders no longer have to race the clock at any cost, so their training spend slows to a pace their revenue can support, and total training demand falls. This matches the consolidation seen at past turning points: when the railway mania ended in 1850, 15 large companies (just 8% of all companies) held 61% of the capital in British railways[19].
Buyer concentration has another consequence. The few big buyers that remain gain bargaining power, and their most direct form of leverage is building their own chips, so the remaining training demand is also more likely to flow to TPUs and Trainium. To be clear, the gap between top models still keeps widening and narrowing again; this is a risk that hasn’t materialized yet but needs to be tracked in advance.
Indicators to watch: the number of labs building frontier-scale training clusters; whether any challenger cuts training investment or switches to calling someone else’s models; the capability gap between top closed models.
Demand II: open models plateau and self-hosting slows
For data security and cost reasons, many enterprises, governments, and smaller cloud providers host open models themselves. This is Nvidia’s most important source of demand outside big tech. A large share of the leading open models come from China, and Chinese labs, constrained by export controls, may hit ceilings on both compute and data. Once open model capabilities stall, enterprises no longer need to provision compute ahead of time for the next, larger model, and GPU demand shifts from a capability-driven upgrade cycle to linear growth driven by usage.
Another force pushes in the same direction: for the same capability, open models keep getting smaller, and distillation and quantization keep lowering the hardware needed to deploy them, so the same usage needs fewer GPUs. Starting this fiscal year, Nvidia splits data center revenue into Hyperscale (public clouds and large internet companies) and ACIE (AI clouds, industrial, and enterprise); self-hosting demand mostly falls in the latter. But ACIE also includes AI clouds like CoreWeave, whose biggest customers are precisely OpenAI and Microsoft, so ACIE growth is only a rough proxy for self-hosting demand.
Indicators to watch: growth in the enterprise and sovereign AI parts of ACIE; the release cadence, parameter size, and capability of open models; changes in the hardware cost of self-hosting at a given capability level.
Demand III: token demand depends on how fast agents spread
Today AI use falls mainly into two categories. Ordinary people use chatbots, which consume a limited number of tokens. Agents consume many more tokens, but they are used mainly by professionals such as programmers, a relatively small group, and those users hand simple tasks like CRUD or file organization to smaller, cheaper models. So whether token demand can keep growing quickly depends on whether agents spread beyond programming to more industries and more ordinary people.
This is exactly the condition for moving from the installation period into the deployment period. The railways’ deployment period rested on tourism and a national market, and the internet’s on search and e-commerce; AI’s deployment period needs new business use cases beyond programming. If agents spread fast, consumption will keep growing; if they spread slowly, a gap will open between capex and actual usage. On the other hand, an agent consumes far more tokens per user than a chatbot, and it can be triggered automatically by business processes without a human operating it, so once agents roll out across enterprises, growth could be very fast.
Indicators to watch: the share of tokens used for non-programming purposes; how widely enterprises deploy agents outside programming; the ratio of leading AI companies’ revenue growth to big tech capex growth.
Competition: custom chips and ecosystem migration
Nvidia’s monopoly is loosening. Anthropic’s main training partner is AWS, and it trains models on Trainium chips; it has also signed up for up to 1 million Google TPUs and uses Nvidia GPUs as well[20]. Meta signed a multi-year contract to rent Google TPUs in February 2026[21], and in April 2026 Google released the TPU 8i, built specifically for inference[22]. Coding agents have also sharply lowered the cost of migrating software from CUDA to other platforms, so the CUDA moat is getting shallower.
Nvidia’s advantage is shifting from individual chips and CUDA toward rack-scale systems, networking, and the supply chain. Networking revenue in Q4 of fiscal 2026 was about $11 billion, up about 2.6x year over year[23]. Competitive pressure will show up first in margins rather than shipments. Nvidia’s current gross margin of about 75% is still above the 72.4% of a year earlier, so the pressure has not shown up yet, and this is the most sensitive indicator of competition to watch[13].
Indicators to watch: Nvidia’s gross margin; market share in data center AI chips; the number of external customers for custom chips like TPU and Trainium.
Supply: memory bandwidth and power bottlenecks
During large-model inference, generation speed is limited mainly by memory bandwidth rather than compute, and HBM bandwidth gets harder to push higher. Capacity is also concentrated in a few manufacturers, and the memory price increases mentioned earlier are a symptom of exactly this. Power is the other bottleneck: data center expansion is increasingly constrained by grid connections and generating capacity.
These two bottlenecks cut both ways for Nvidia. On one hand, the tighter power gets, the more valuable a more energy-efficient new generation becomes, and customers have a reason to replace old GPUs with new ones, which favors Nvidia. On the other hand, if HBM progress slows, each new GPU generation improves less over the last, customers have less reason to upgrade, old GPUs stay useful for longer, and big tech will stretch GPU depreciation periods accordingly. The more durable GPUs become, the more they resemble the fiber and routers of 2000: the excess compute bought during the bubble takes years to absorb, demand for new GPUs stays depressed in the meantime, and Nvidia moves closer to Cisco’s script.
Indicators to watch: HBM process progress, capacity, and prices; data center grid connections and grid buildout; changes by big tech to the depreciation lives of GPUs.
Geopolitics: Taiwan and China
Nearly all of Nvidia’s high-end GPUs are made by TSMC in Taiwan, and advanced packaging is also mostly in Taiwan; US capacity can only take on a small share in the near term. A single military exercise around Taiwan or a blockade could disrupt supply, upend market expectations about capacity, and set off a chain reaction. This is the biggest single point of failure on the supply side.
The China risk has already materialized. Jensen Huang has said Nvidia’s share in China is essentially zero, and even with the US approving H200 exports, Nvidia’s guidance still counts China data center revenue as zero[24]. In the short term this is already priced in. In the long term, the Chinese market that has been shut out is nurturing domestic alternatives like Huawei, which may become competitors in the global market.
Indicators to watch: US-China relations and the situation in the Taiwan Strait; the production ramp of TSMC’s US fabs; shipments of Huawei and other domestic Chinese AI chips.
Conclusion
No technological revolution in history has skipped the turning point, and Nvidia, as the shovel seller of this one, will eventually face its own bust. The real question is not whether but when, and how. A turn usually needs a trigger: a military exercise around Taiwan that disrupts supply, a renewed round of Fed rate hikes that makes money more expensive, or a debt default by some highly leveraged player in the chain, with the damage spreading through circular financing.
Compared with Cisco in 2000, Nvidia’s valuation is far less extreme and its stock price rests more on real profits, so even if the bubble bursts, the process may be relatively mild. But mild does not mean risk-free. The indicators listed in each section above are the early signals of a turn, and they deserve close and continuous attention.
References
- Wikipedia. Technological Revolutions and Financial Capital. en.wikipedia.org
- Wikipedia. Canal Mania. en.wikipedia.org
- Liberty Street Economics (New York Fed). Crisis Chronicles: Canal Mania (1793). libertystreeteconomics.newyorkfed.org
- Andrew Odlyzko. Collective hallucinations and inefficient markets: The British Railway Mania of the 1840s. umn.edu/…/hallucinations.pdf
- Liberty Street Economics (New York Fed). Crisis Chronicles: Railway Mania, the Hungry Forties, and the Commercial Crisis of 1847. libertystreeteconomics.newyorkfed.org
- Cisco. Annual Report Fiscal 2002 (Form 10-K, Exhibit 13). sec.gov
- Wikipedia. Dark fibre. en.wikipedia.org
- Pew Research Center. Home Broadband Adoption 2008. pewresearch.org
- Yahoo Finance. Cisco Systems (CSCO) Shares Hit a Record High For The First Time In Over 25 Years. finance.yahoo.com
- Federal Reserve. Remarks by Chairman Alan Greenspan: The Challenge of Central Banking in a Democratic Society. federalreserve.gov
- The Motley Fool. Nvidia’s Forward P/E Has Actually Fallen as Its Stock Price Rose. Here’s How That’s Possible. fool.com
- NVIDIA. NVIDIA Announces Financial Results for First Quarter Fiscal 2027. nvidianews.nvidia.com
- NVIDIA. NVIDIA Announces Financial Results for Second Quarter Fiscal 2027. nvidianews.nvidia.com
- CIO Dive. Nvidia posts $82B in revenue as it diversifies its customer base. ciodive.com
- Let’s Data Science. Amazon Raises 2026 Capital Spending Forecast to $220 Billion. letsdatascience.com
- Amazon. Amazon.com Announces Second Quarter Results (Form 8-K, Exhibit 99.1). sec.gov
- Bloomberg. Nvidia, OpenAI Make $100 Billion Deal to Build Data Centers. news.bloomberglaw.com
- The Decoder. Nvidia reportedly set to invest $30 billion in OpenAI. the-decoder.com
- T. R. Gourvish. Railway Enterprise (in The Dynamics of Victorian Business). taylorfrancis.com
- Anthropic. Expanding our use of Google Cloud TPUs and Services. anthropic.com
- Dataconomy. Meta signs multibillion-dollar deal to rent Google TPUs for AI training. dataconomy.com
- SiliconANGLE. Google unveils new TPUs to power the next wave of AI training and inference. siliconangle.com
- NVIDIA. CFO Commentary on Fourth Quarter and Fiscal 2026 Results. sec.gov
- TechRadar. Jensen Huang says Nvidia’s China market share fallen to zero. techradar.com